What is Data Visualization?
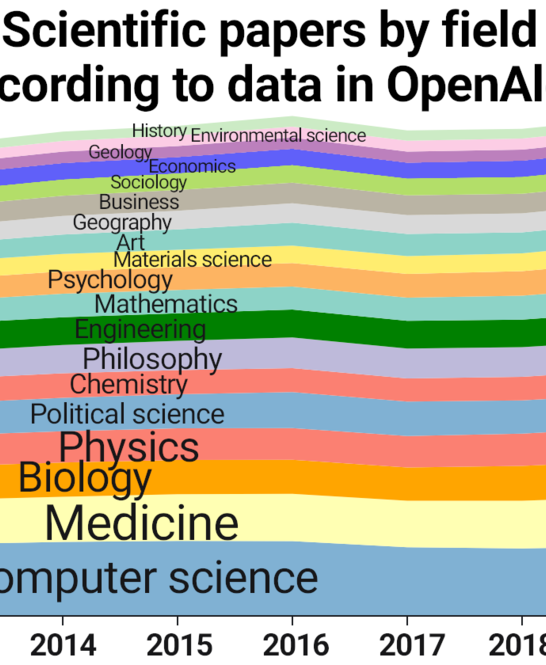
Data visualization involves the graphical representation of information to facilitate communication. Data visualization serves as a bridge between raw data and human understanding, transforming numerical values and complex relationships into visual, often interactive, representations. But what makes data visualization truly intriguing is its marriage of science and art, two disciplines that bring into play the ideas of visual language and semiotics. These elements not only enhance the aesthetics of a visualization but also impact how data is interpreted, thus affecting decision-making processes.
Key Words: Design; Design Principles; Elements of Art; Infographic; Photography; Semiotics; Visual Brainstorming; Visual Language; Visual Literacy
Core Principles of Data Visualization
Understanding the core tenets of data visualization can be broken down into several key points:
- Graphical Representation: The core of data visualization is converting raw data into visual formats like charts, graphs, and heatmaps. This is where elements of art—such as color, line, and shape—play crucial roles.
- Insight Discovery: Through graphical representation, it becomes easier to identify patterns, trends, or outliers in large data sets, fulfilling the informative function of semiotics.
- Communication Tool: It serves as an impactful medium to convey complex data findings in a comprehensible way. The principles of design like proximity and alignment organize information to enhance clarity and readability.
- Interactivity: Modern data visualization tools often allow users to interact with the data, offering a dynamic experience. This aligns with the principles of design like balance and repetition to maintain visual coherency during interaction.
- Variety of Forms: Data can be visualized in myriad ways—from straightforward bar charts to intricate 3D plots—each with its own set of aesthetic and functional considerations.
- Decision-Making Aid: In businesses and various organizations, data visualizations serve as invaluable tools for data-driven decision-making.
- Multi-Disciplinary Utility: From art and design to statistics and data science, the utility of data visualization extends across diverse fields, making it universally applicable.
- Aesthetic Considerations: Principles of design like contrast and repetition, along with elements of art like color and line, contribute to the visual appeal of the data representation.
- Simplification and Abstraction: While the data is simplified for easier comprehension, care is taken to preserve its accuracy and integrity, maintaining a delicate balance between readability and reliability.
- Accessibility: Inclusive design ensures that data visualizations are accessible to people with disabilities, reinforcing the importance of universal design principles.
Theoretical Frameworks
Data visualization is an interdisciplinary practice that involves converting complex data into easily digestible graphical representations. This pivotal tool for understanding, analysis, and decision-making draws from various areas of expertise, including semiotics, visual language, elements of art, and principles of design.
- Semiotics: Symbols and signs in visual language convey specific meanings, adding layers of understanding to the data.
- Visual Language: Governed by principles of design and elements of art, visual language provides the rules and syntax for creating meaningful visualizations.
- Elements of Art: Components like color, line, and shape serve as the building blocks of the visual representation, making it more engaging and informative.
- Principles of Design: Concepts like proximity, alignment, repetition, and contrast are the grammar of visual language that organize and enhance the data presentation.
Why Data Visualization Matters
- Quick Interpretation: It facilitates rapid understanding, given the human propensity for visual learning.
- Universal Comprehension: Visual elements often transcend language barriers, making information accessible on a global scale.
- Enhanced Decision-Making: Simplified yet accurate representations of complex data sets provide actionable insights.
Recommended Readings
- Information Is Beautiful’s Data Visualizations page presents brilliant data visualizations that make it easier for readers to make sense of facts and figures. Information is beautiful. (2023). COVID-19 coronavirus data dashboard. Informationisbeautiful.net. https://informationisbeautiful.net/visualizations/covid-19-coronavirus-infographic-datapack/
- Lenger and Eppler’s Periodic Table of Data Visualization Methods includes examples of a far broader range of strategies for visualizing data. Visual Literacy. (n.d.). A periodical table of visualization methods. Visual-literacy.org. https://www.visual-literacy.org/periodic_table/periodic_table.html
- Review of Best Practices in Data Visualization
- Franconeri, L, Padilla L. M., Shah, P., Zacks, J . M., & Hullman, J. (2021). The science of visual data communication: What works. Psychological Science in the Public Interest, 22(3), iii-161.
Conclusion
Data visualization is far more than mere aesthetic representation; it is a multi-disciplinary field that coalesces data interpretation with art and design. Through a harmonious blend of semiotics, visual language, artistic elements, and design principles, it serves as a powerful tool for data comprehension, decision-making, and universal communication. Its wide array of applications across various fields underlines its significance in contemporary academia and industry.


